9.0 Final Software Implementation
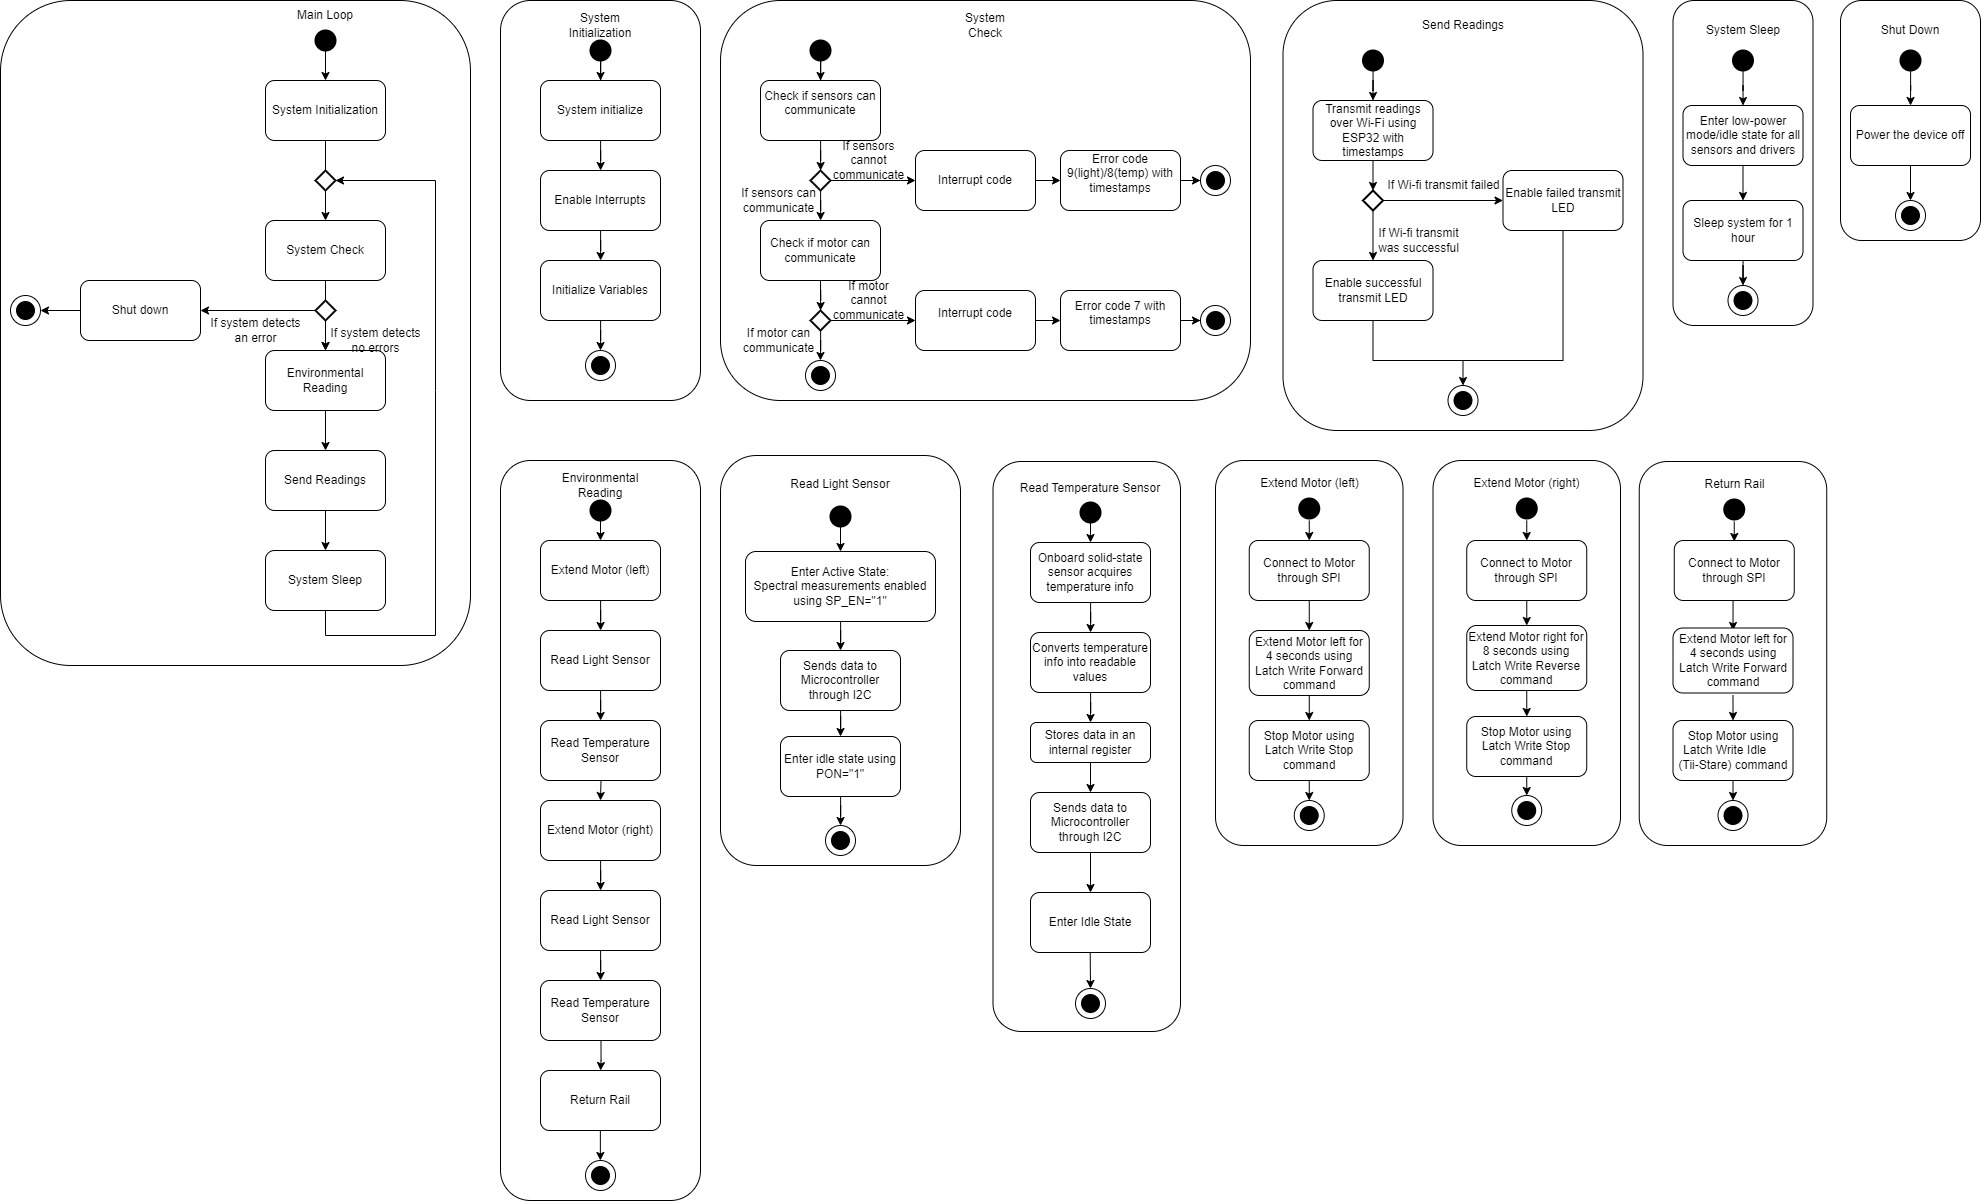
9.1 InitialSoftware UML Diagram

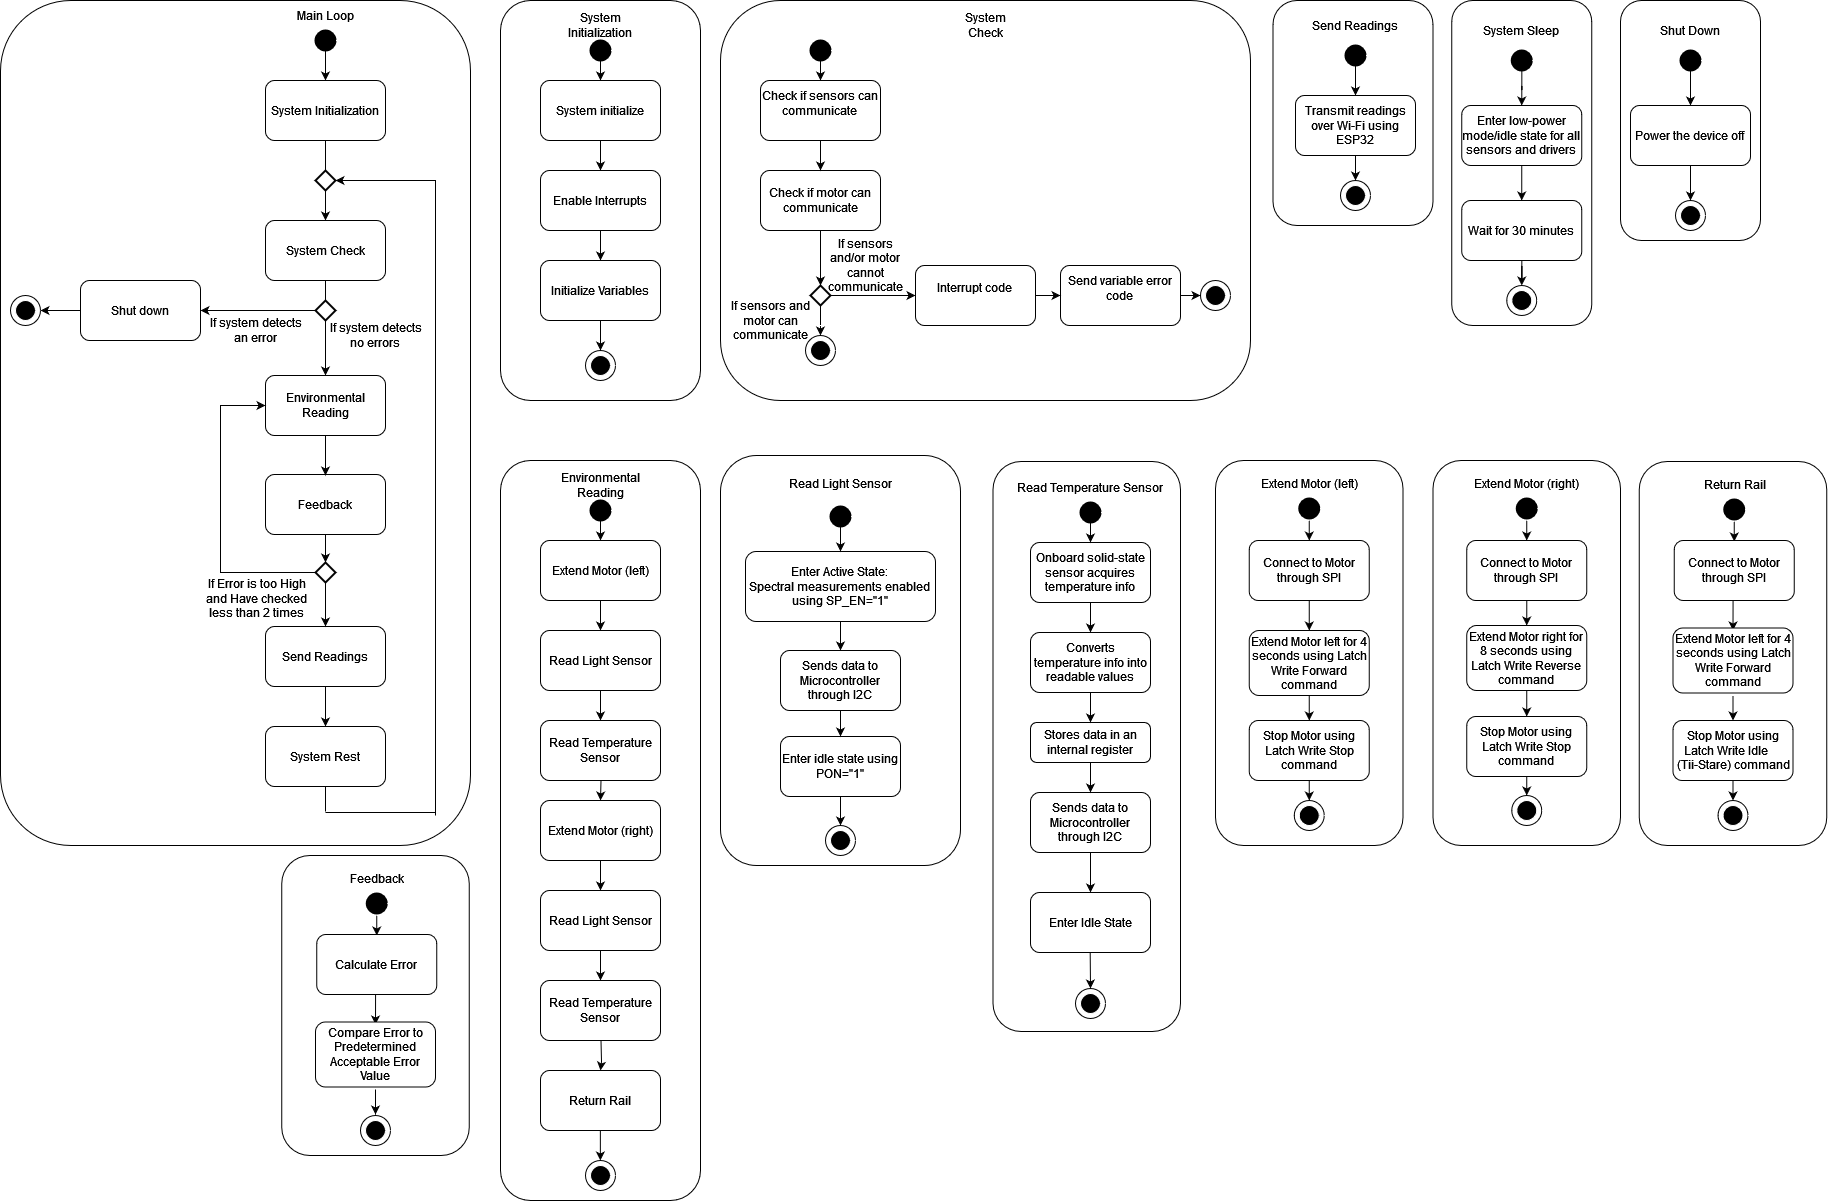
9.2 Updated Software Proposal Diagram

9.3 Software UML Diagram Explanation
Team 305’s software proposal is seperated into a myriad of code blocks. The “Main Loop” block is where the climate monitoring system begins on startup. After initializing the internal systems and variables and enabling interrupts, the system does a quick check to see if the subsystems can communicate correctly. If the sensors or motor cannot, the program sends an error code over Wi-fi with appropriate timestamps detailing what subsystem has caused an error and subsequently shuts down. Otherwise, the program continues to the “Environmental Reading” stage. The motor runs, moving the rail and positioning the sensors to take their readings. After taking the initial readings, the motor extends the rail the opposite direction, and the sensors read their environmental data again. The rail is then returned to the initial position.
After taking the data readings, the program sends said readings to the website over Wi-fi. Afterwards, the system then enters a low-power resting mode for 30 minutes before running from the “System Check” block again.
This software proposal has a straightforward, simple design plan that allows for ease of programming and simple debugging. The software proposal also allows for clear data transmission with the use of timestamps, as well as simple and easy to understand user feedback in case something goes wrong.
9.4 Changes to the diagram
- Removal of timestamps when sending data; The method for adding timestamps was not able to be found and worked in, so the idea was scrapped.
- Removal of status LEDs for ESP32 transmission; There were no LEDs for a successful/failed transmission visual indicator on the PCB, nor could Team 305 determine how to tell if data had been sent over Wi-Fi.
- Collection of error codes into one print statement; This was mainly done to simplify the code and give more feedback to the user.
- Addition of a error feedback function; This was added as a requirement for some kind of error control implementation.
- Reduction in the time between readings; Team 305 felt that an hour was too long between readings, and so reduced the time between them down to 30 minutes from an hour.
9.5 Possible changes to the software design
All things considered, some combination of the original and final software diagrams would be ideal to implement. Getting the code for timestamps and adding the transmit status LEDs would significantly improve user interactivity, readability, and feedback. The addition of the error feedback, as well as the simplification in error codes and reduction in time between readings were all positive changes that enhanced the final project. If the physical design was changed to not include a moving rail, the ideal functionality of the sensors would be an always-on state constantly pushing data readings to ther server; about once a second.
9.6 MQTT Topic Table and C code
To view the MQTT topic table and C code written for this project, please see Appendix E: MQTT Topic Table and C Code.